iFANN
    ค้นหาใน iFANN...
    เข้าสู่ระบบ
    หน้าแรก
    ข่าว
    วิดีโอ
    หนังสือ
    รูปภาพ
    GIF
    สำรวจ
    โพล
    รางวัล
    iFAMOUS
    วิกิ
    อนิเมะ
    ห้อง
    การแจ้งเตือน
    ข้อความ
    ที่บันทึกไว้
    โปรไฟล์
    วิกิรางวัลiFAMOUSอันดับอุตสาหกรรมรางวัลครีเอเตอร์รางวัลผู้ใช้ข้อกำหนดความเป็นส่วนตัวหลักเกณฑ์ชุมชนแจ้งลบ / DMCAช่วยเหลือนักพัฒนา

    © 2026 iFANN

    หน้าแรก
    ค้นหา
    ข้อความ
    การแจ้งเตือน
    โปรไฟล์
    รูปภาพ
    Tyler Dublin
    Tyler Dublin@tyler_dublin1mo
    📱Brent Crude Oil💭Finance💭Investing
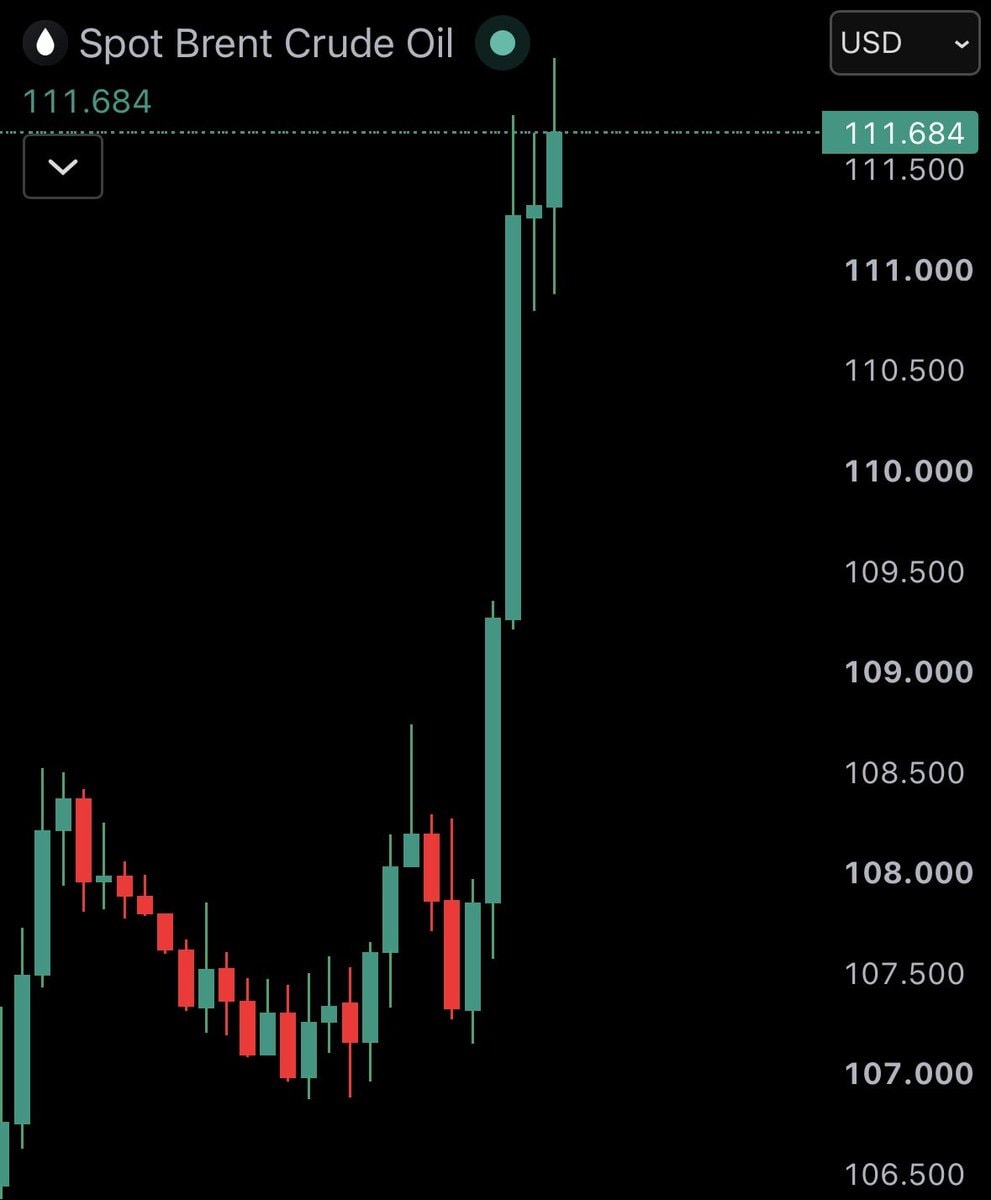
    Brent crude oil price chart

    @tyler_dublinBrent crude oil prices have risen above $111. wild though

    ดูโพสต์ต้นฉบับ

    Brent crude oil price chart

    รูปภาพโดย @tyler_dublin· Oct 17, 2026· Brent Crude Oil

    เกี่ยวกับรูปนี้

    The focus is a financial chart displaying the price of Spot Brent Crude Oil. The chart shows a steep upward trend with green and red candlesticks against a black background. The mood is analytical and informative, typical of financial data presentation. A notable detail is the sharp spike in the price, indicating significant volatility. ON-SCREEN TEXT: Spot Brent Crude Oil 111.684 USD 111.684 111.500 111.000 110.500 110.000 109.500 109.000 108.500 108.000 107.500 107.000 106.500
    ดูรูปภาพ Brent Crude Oil ทั้งหมดอ่านวิกิ Brent Crude Oil

    ?

    รูปภาพ Brent Crude Oil เพิ่มเติม

    ดูรูปภาพ Brent Crude Oil ทั้งหมด
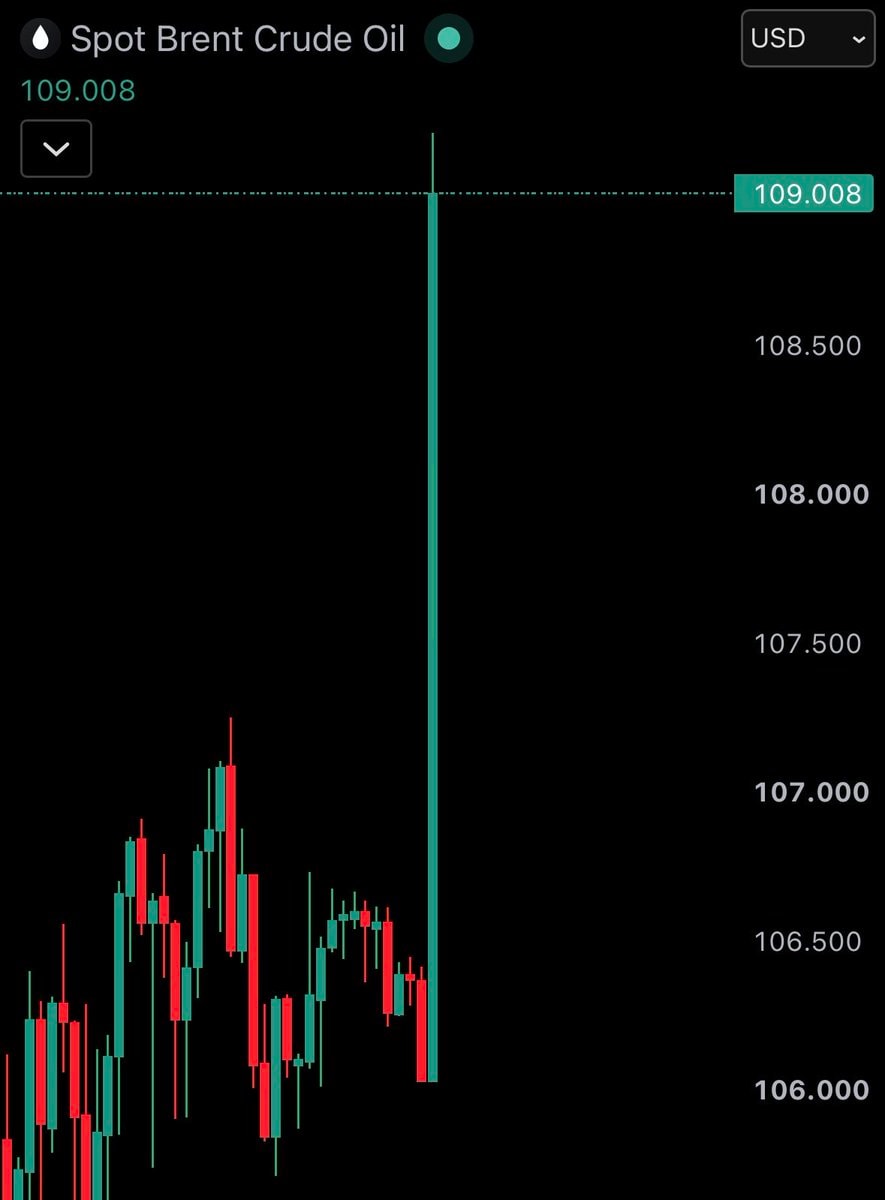
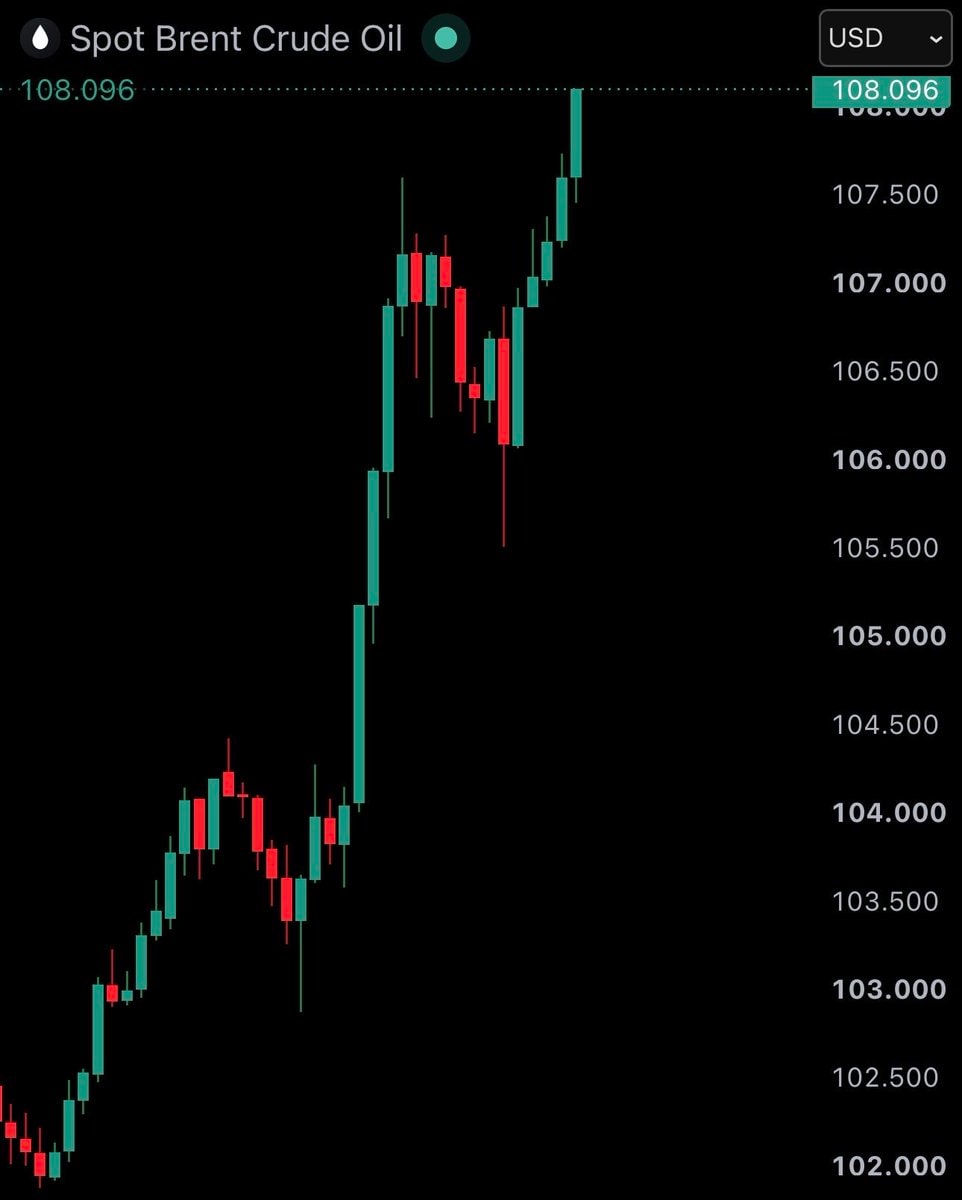
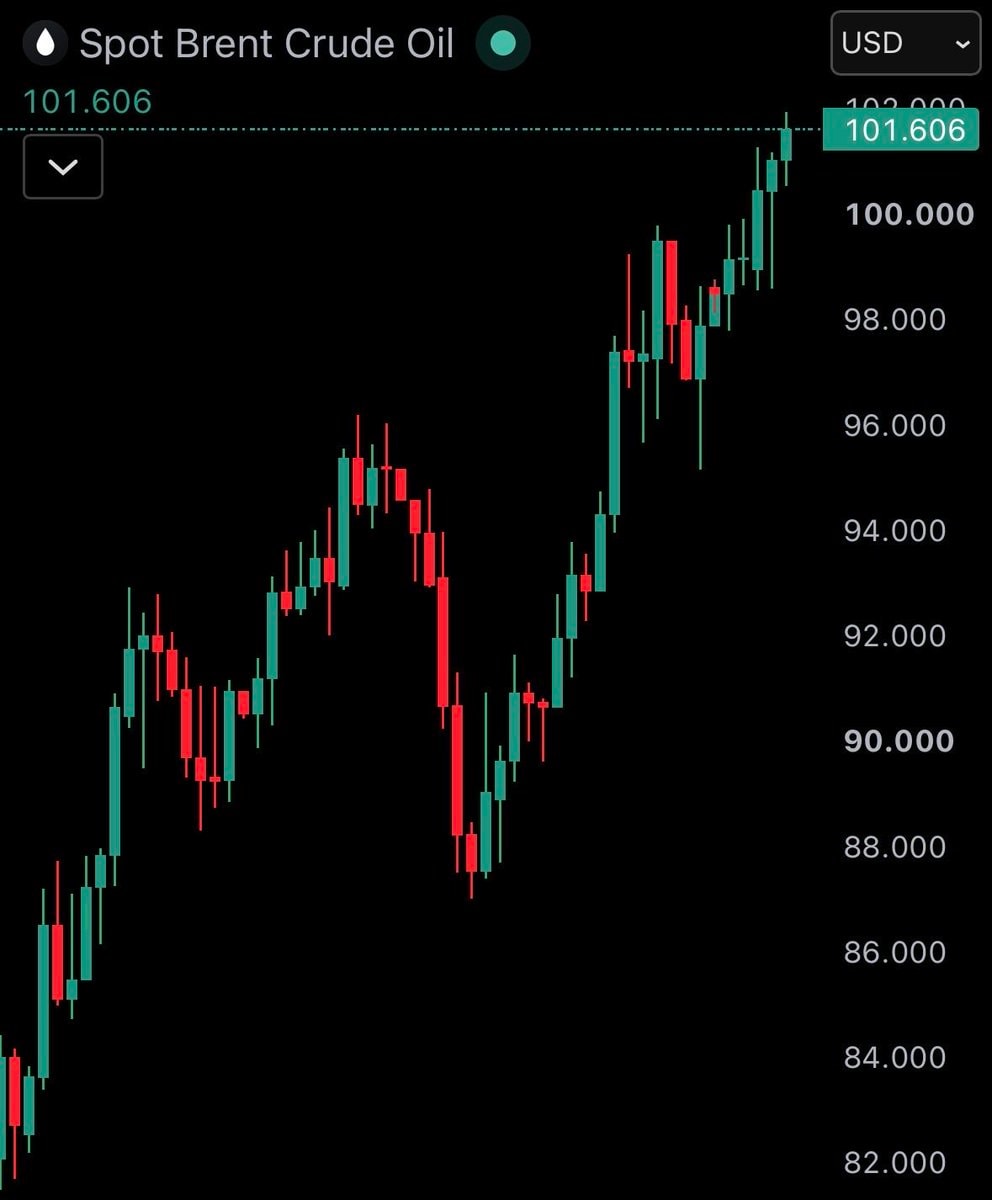
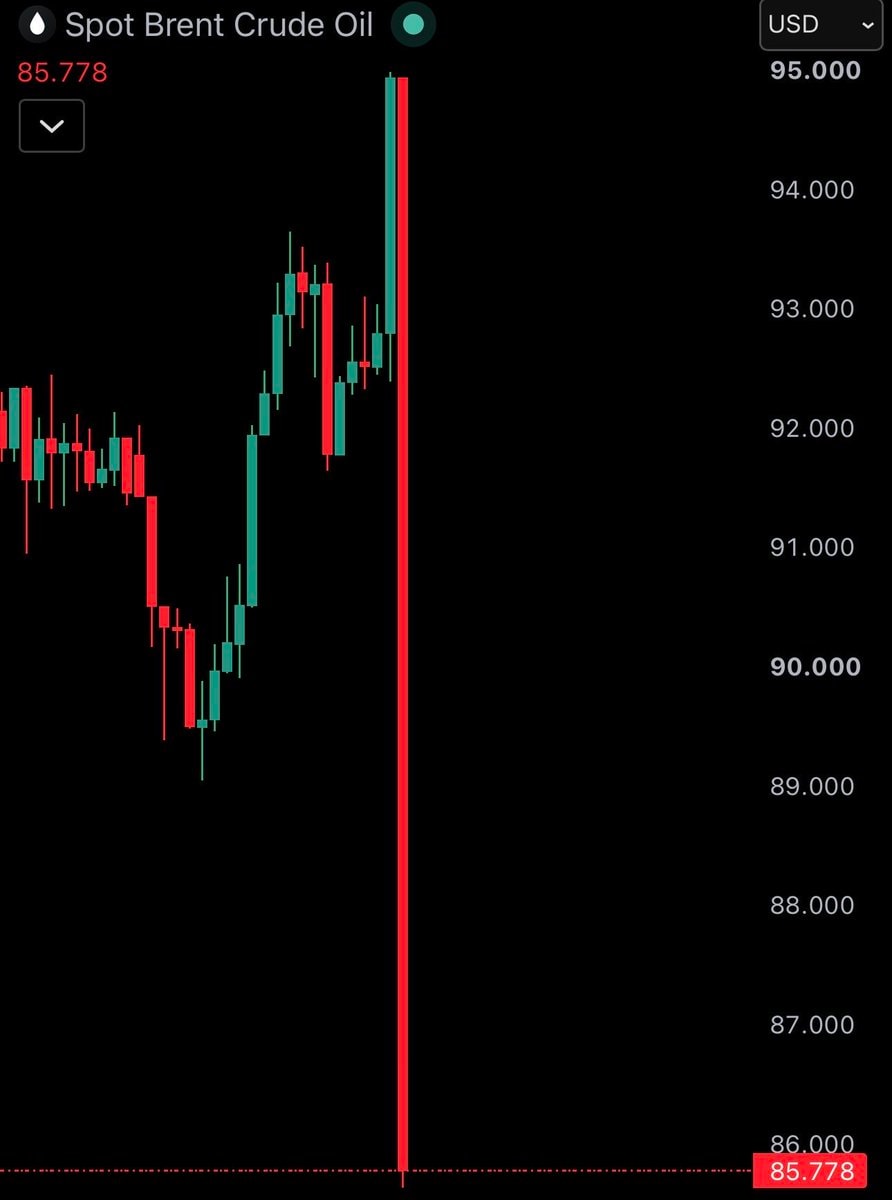
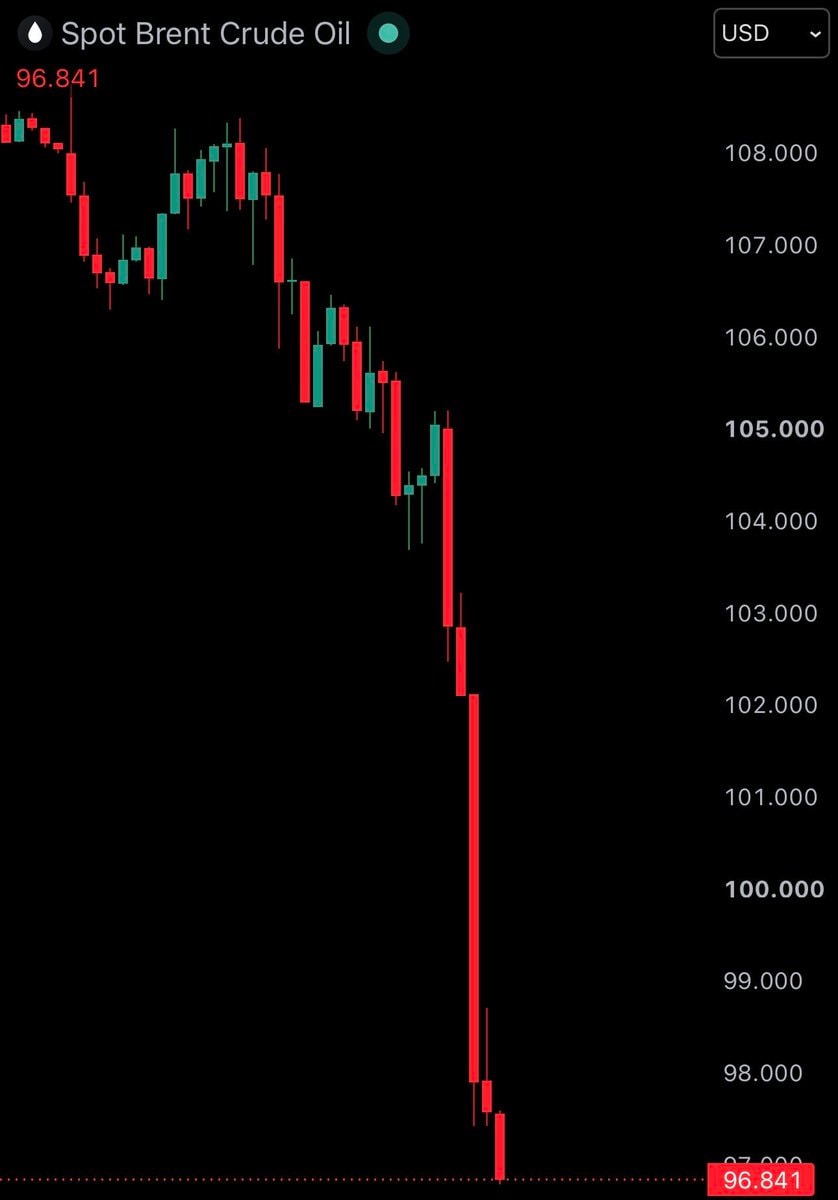
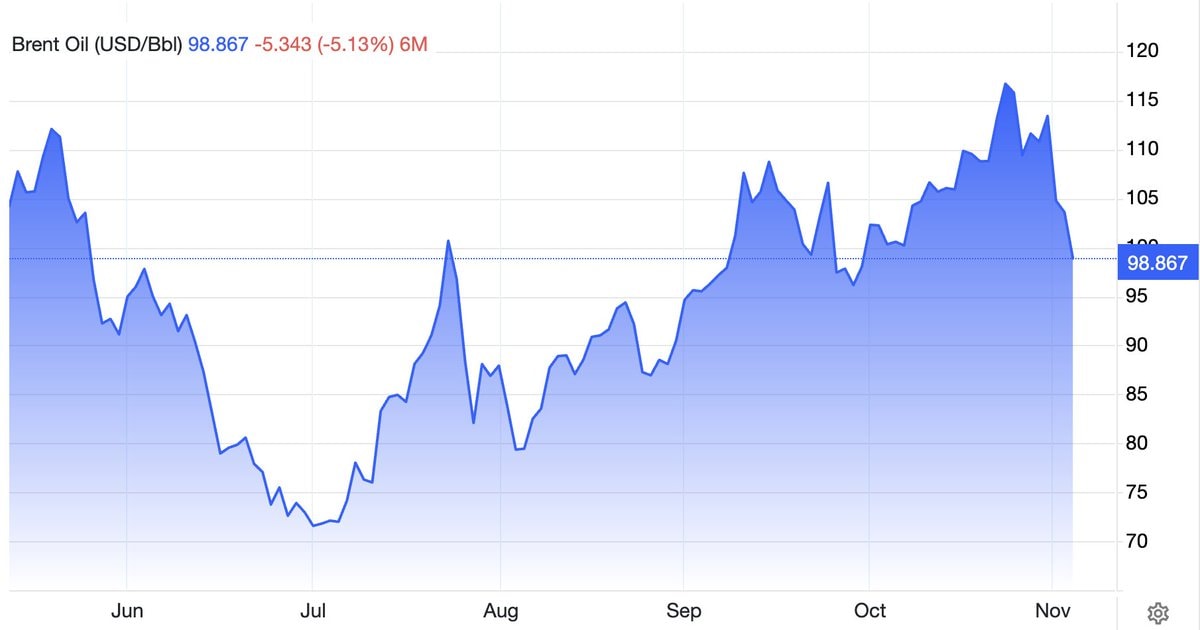
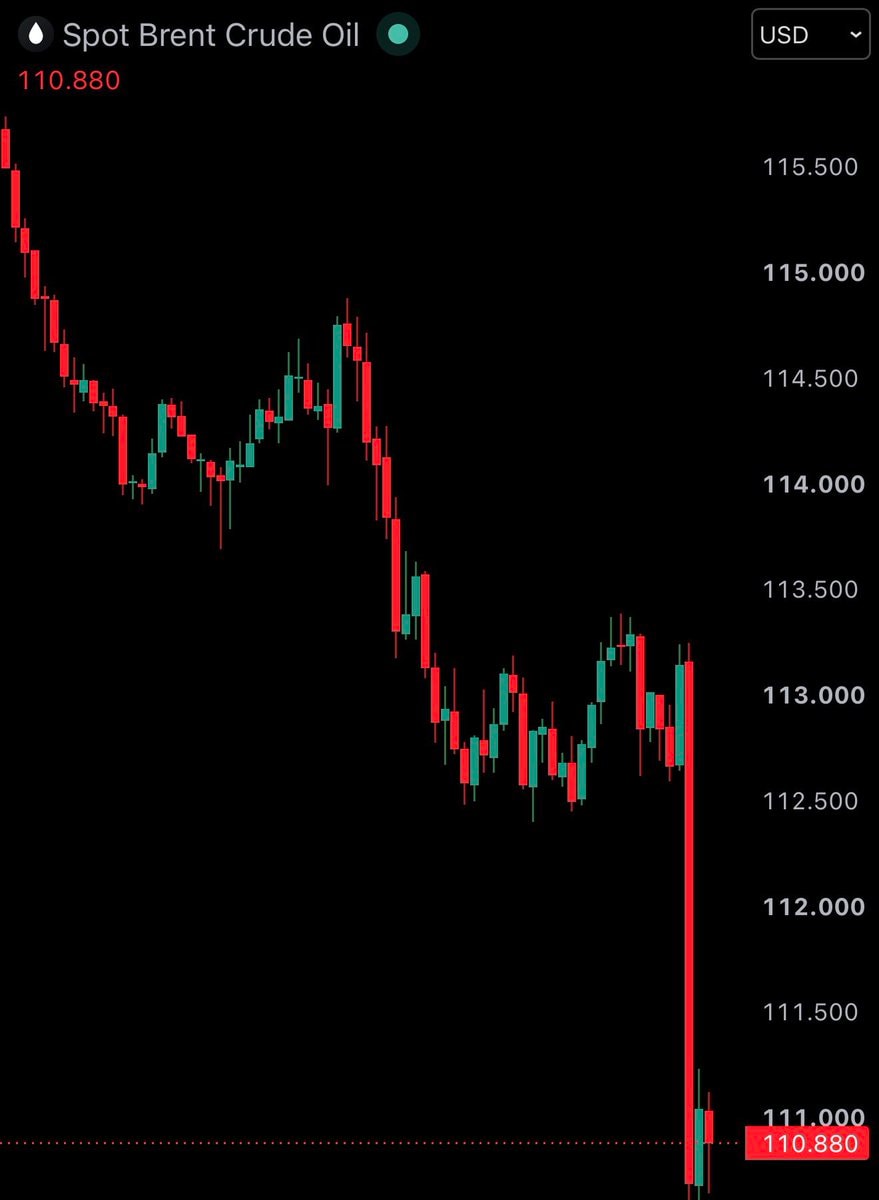
    Brent crude oil chartBrent crude oil chartBrent crude price chartBrent crude price chartBrent Crude Oil price dropBrent Crude Oil price dropBrent crude oil price surgeBrent crude oil price surgeBrent Crude Oil price chartBrent Crude Oil price chartBrent crude oil price chartBrent crude oil price chartBrent Crude Oil 10% drop after US Iran haltBrent Crude Oil 10% drop after US Iran haltBrent crude oil falls to $752Brent crude oil falls to $75
    รูปภาพ
    Tyler Dublin
    Tyler Dublin@tyler_dublin1mo
    📱Brent Crude Oil💭Finance💭Investing
    Brent crude oil price chart

    @tyler_dublinBrent crude oil prices have risen above $111. wild though

    ดูโพสต์ต้นฉบับ

    Brent crude oil price chart

    รูปภาพโดย @tyler_dublin· Oct 17, 2026· Brent Crude Oil

    เกี่ยวกับรูปนี้

    The focus is a financial chart displaying the price of Spot Brent Crude Oil. The chart shows a steep upward trend with green and red candlesticks against a black background. The mood is analytical and informative, typical of financial data presentation. A notable detail is the sharp spike in the price, indicating significant volatility. ON-SCREEN TEXT: Spot Brent Crude Oil 111.684 USD 111.684 111.500 111.000 110.500 110.000 109.500 109.000 108.500 108.000 107.500 107.000 106.500
    ดูรูปภาพ Brent Crude Oil ทั้งหมดอ่านวิกิ Brent Crude Oil

    ?

    รูปภาพ Brent Crude Oil เพิ่มเติม

    ดูรูปภาพ Brent Crude Oil ทั้งหมด
    Brent crude oil chartBrent crude oil chartBrent crude price chartBrent crude price chartBrent Crude Oil price dropBrent Crude Oil price dropBrent crude oil price surgeBrent crude oil price surgeBrent Crude Oil price chartBrent Crude Oil price chartBrent crude oil price chartBrent crude oil price chartBrent Crude Oil 10% drop after US Iran haltBrent Crude Oil 10% drop after US Iran haltBrent crude oil falls to $752Brent crude oil falls to $75