
iFANN
    ค้นหาใน iFANN...
    เข้าสู่ระบบ
    หน้าแรก
    ข่าว
    วิดีโอ
    รูปภาพ
    GIF
    สำรวจ
    โพล
    รางวัล
    iFAMOUS
    วิกิ
    อนิเมะ
    ห้อง
    การแจ้งเตือน
    ข้อความ
    ที่บันทึกไว้
    โปรไฟล์
    วิกิรางวัลiFAMOUSอันดับอุตสาหกรรมรางวัลครีเอเตอร์รางวัลผู้ใช้ข้อกำหนดความเป็นส่วนตัวหลักเกณฑ์ชุมชนแจ้งลบ / DMCAช่วยเหลือนักพัฒนา

    © 2026 iFANN

    หน้าแรก
    ค้นหา
    ข้อความ
    การแจ้งเตือน
    โปรไฟล์
    รูปภาพ
    Not A Newt
    Not A Newt@not_a_newt1mo
    💭Finance
    GDP PPP Growth Europe vs US Since 1989

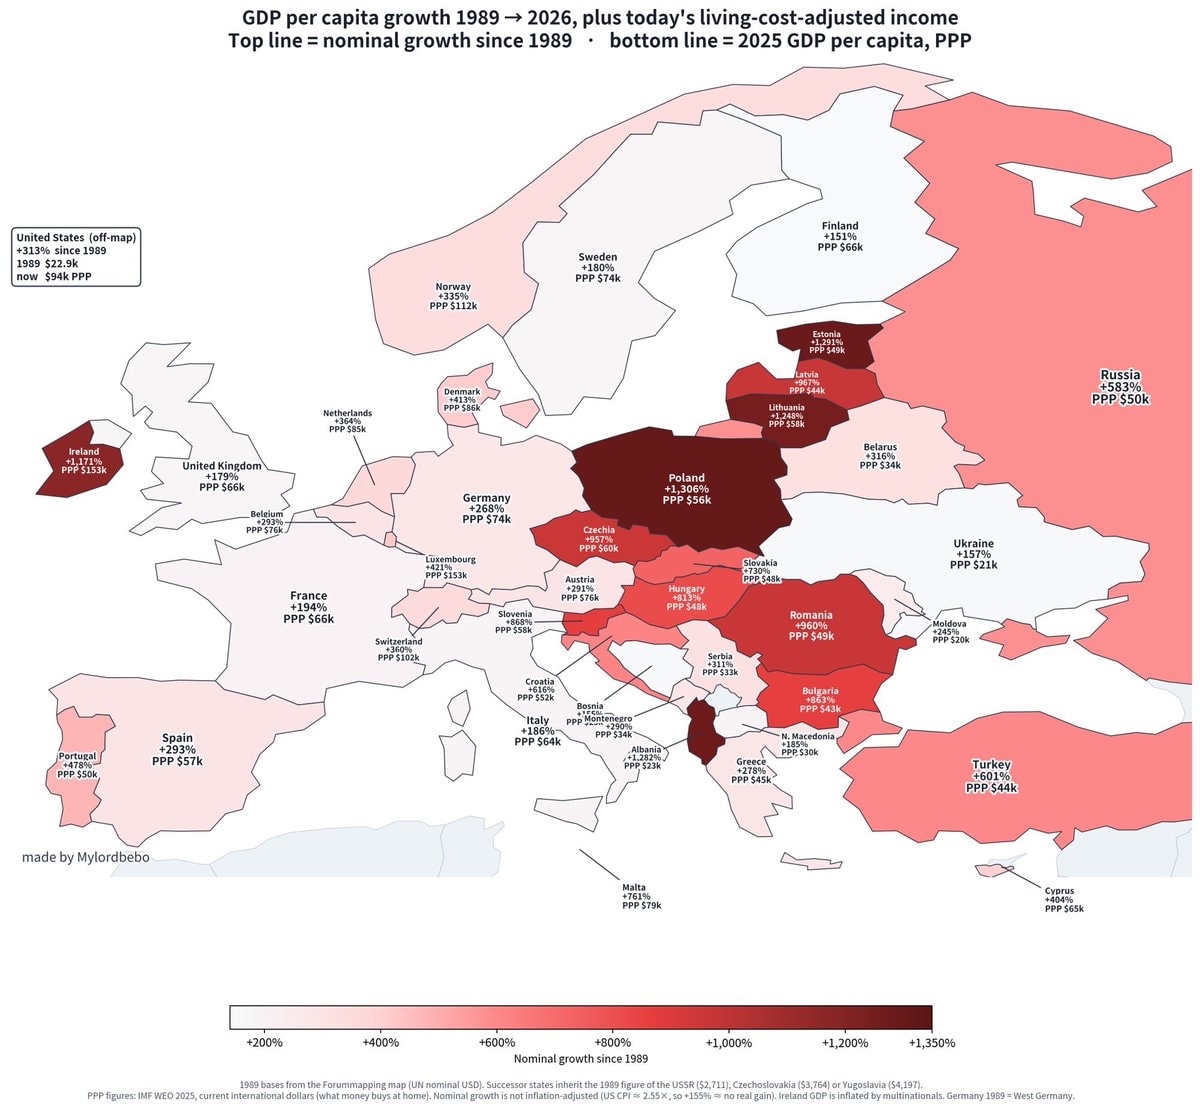
    @not_a_newtWestern Europe has been stuck in slower growth for a long time now. The UK, Italy, and France recorded GDP PPP growth of just 179% since 1989. Compare that to the US which hit 313% over the same period. Former Soviet bloc nations saw massive jumps too, though Ukraine is the exception. This data suggests the emerging AI economy will push Europe even further behind. #Finance

    ดูโพสต์ต้นฉบับ

    GDP PPP Growth Europe vs US Since 1989

    รูปภาพโดย @not_a_newt· Sep 25, 2026· Finance

    เกี่ยวกับรูปนี้

    The image is a choropleth map of Europe showing GDP per capita growth from 1989 to 2026. Countries are colored based on their nominal growth since 1989, with darker shades indicating higher growth. Text overlays on each country display the percentage growth and the 2025 GDP per capita in PPP dollars. The mood is informative and data-driven, with a clear aesthetic focused on presenting economic statistics. A notable detail is the legend at the bottom, which explains the color scale and the basis of the data. ON-SCREEN TEXT: GDP per capita growth 1989 → 2026, plus today’s living-cost-adjusted income Top line = nominal growth since 1989 • bottom line = 2025 GDP per capita, PPP United States (off-map) +313% since 1989 1989 $22.9k now $94k PPP made by Mylordbebo +200% +400

    ดูรูปภาพ Finance ทั้งหมด

    ?

    รูปภาพ Finance เพิ่มเติม

    ดูรูปภาพ Finance ทั้งหมด
    Series B debt dashboard end of 2025Series B debt dashboard end of 2025Jensen Huang returns as Nvidia CEO2Jensen Huang returns as Nvidia CEONvidia 10-Q paper gains explainedNvidia 10-Q paper gains explainedBitcoin price movement chartBitcoin price movement chartCrypto longs liquidated $645,000,000Crypto longs liquidated $645,000,000Bitcoin BTC crash under $66,000Bitcoin BTC crash under $66,000Bitcoin U.S. Dollar crash4Bitcoin U.S. Dollar crashBitcoin crash $67,000Bitcoin crash $67,000Kalshi FAA grounding betting marketsKalshi FAA grounding betting marketsmajor companies based in Argentinamajor companies based in ArgentinaJim Cramer on Jensen HuangJim Cramer on Jensen HuangBitcoin falls under $70,000Bitcoin falls under $70,000Sydney Sweeney net worth2Sydney Sweeney net worthBitcoin falls under $71,000Bitcoin falls under $71,000GTA 6 Newzoo sales projection2GTA 6 Newzoo sales projectionBitcoin under $72,0002Bitcoin under $72,000Havan R$ 300,000 penalty2Havan R$ 300,000 penalty
    รูปภาพ
    Not A Newt
    Not A Newt@not_a_newt1mo
    💭Finance
    GDP PPP Growth Europe vs US Since 1989

    @not_a_newtWestern Europe has been stuck in slower growth for a long time now. The UK, Italy, and France recorded GDP PPP growth of just 179% since 1989. Compare that to the US which hit 313% over the same period. Former Soviet bloc nations saw massive jumps too, though Ukraine is the exception. This data suggests the emerging AI economy will push Europe even further behind. #Finance

    ดูโพสต์ต้นฉบับ

    GDP PPP Growth Europe vs US Since 1989

    รูปภาพโดย @not_a_newt· Sep 25, 2026· Finance

    เกี่ยวกับรูปนี้

    The image is a choropleth map of Europe showing GDP per capita growth from 1989 to 2026. Countries are colored based on their nominal growth since 1989, with darker shades indicating higher growth. Text overlays on each country display the percentage growth and the 2025 GDP per capita in PPP dollars. The mood is informative and data-driven, with a clear aesthetic focused on presenting economic statistics. A notable detail is the legend at the bottom, which explains the color scale and the basis of the data. ON-SCREEN TEXT: GDP per capita growth 1989 → 2026, plus today’s living-cost-adjusted income Top line = nominal growth since 1989 • bottom line = 2025 GDP per capita, PPP United States (off-map) +313% since 1989 1989 $22.9k now $94k PPP made by Mylordbebo +200% +400

    ดูรูปภาพ Finance ทั้งหมด

    ?

    รูปภาพ Finance เพิ่มเติม

    ดูรูปภาพ Finance ทั้งหมด
    Series B debt dashboard end of 2025Series B debt dashboard end of 2025Jensen Huang returns as Nvidia CEO2Jensen Huang returns as Nvidia CEONvidia 10-Q paper gains explainedNvidia 10-Q paper gains explainedBitcoin price movement chartBitcoin price movement chartCrypto longs liquidated $645,000,000Crypto longs liquidated $645,000,000Bitcoin BTC crash under $66,000Bitcoin BTC crash under $66,000Bitcoin U.S. Dollar crash4Bitcoin U.S. Dollar crashBitcoin crash $67,000Bitcoin crash $67,000Kalshi FAA grounding betting marketsKalshi FAA grounding betting marketsmajor companies based in Argentinamajor companies based in ArgentinaJim Cramer on Jensen HuangJim Cramer on Jensen HuangBitcoin falls under $70,000Bitcoin falls under $70,000Sydney Sweeney net worth2Sydney Sweeney net worthBitcoin falls under $71,000Bitcoin falls under $71,000GTA 6 Newzoo sales projection2GTA 6 Newzoo sales projectionBitcoin under $72,0002Bitcoin under $72,000Havan R$ 300,000 penalty2Havan R$ 300,000 penalty