
@Jakob.erasUS stock market adds over $1.1 trillion in a single session
ดูโพสต์ต้นฉบับ@Jakob.erasUS stock market adds over $1.1 trillion in a single session
ดูโพสต์ต้นฉบับรูปภาพโดย @Jakob.eras· Jul 30, 2026· Stock Market
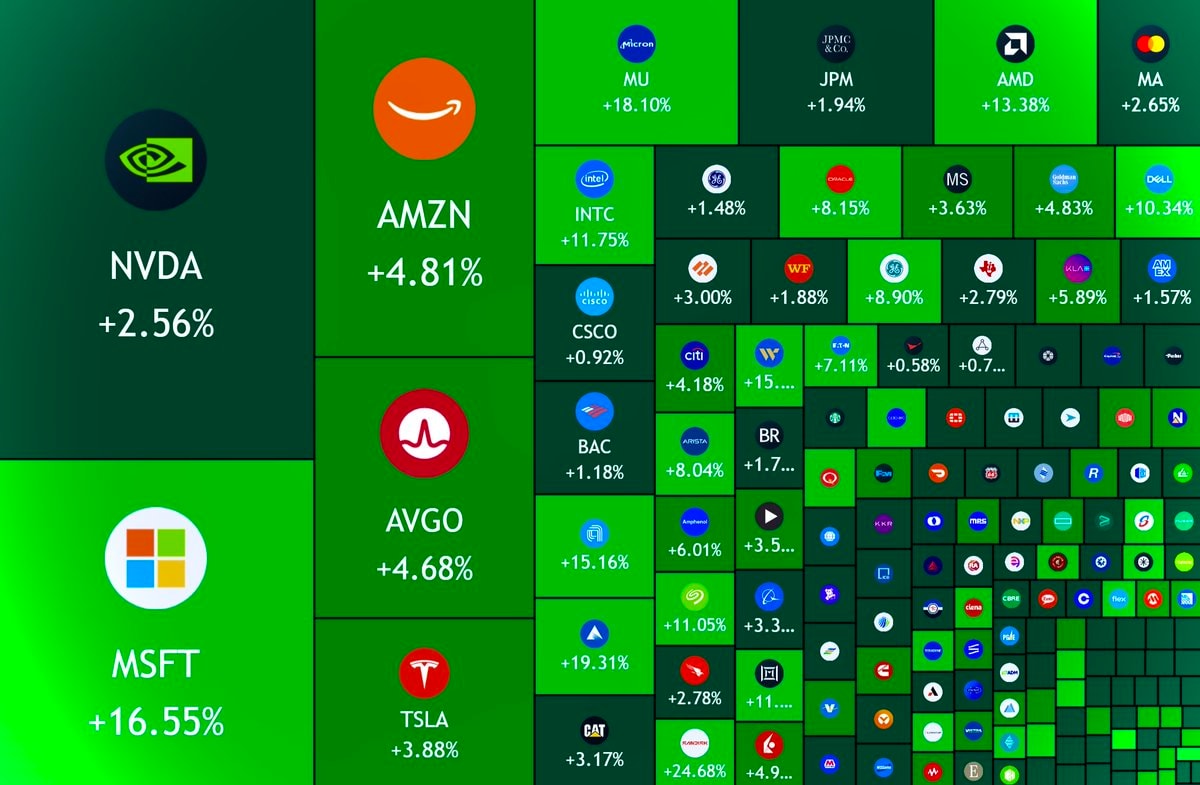
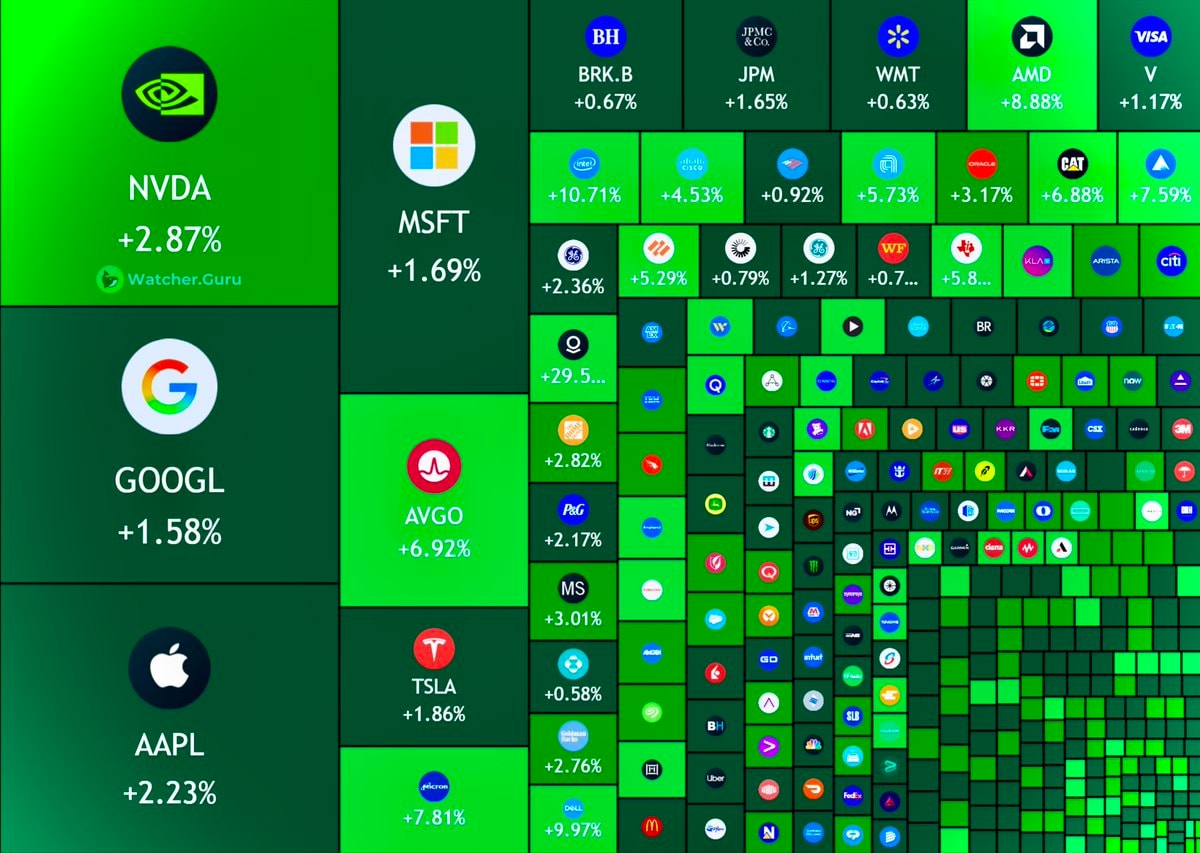
The image is a stock market heatmap displaying company logos and their percentage changes. The focus is on various publicly traded companies, with some prominent ones like NVDA, AMZN, and MSFT highlighted in larger tiles. The overall mood is informative and data-driven, presented in a clean, digital aesthetic. Notably, the green color scheme indicates positive stock performance, with large gains visible for MSFT (+16.55%) and MU (+18.10%). The on-screen text includes company tickers and their corresponding percentage changes, such as "NVDA +2.56%", "AMZN +4.81%", and "MSFT +16.55%".
 S&P 500 record close
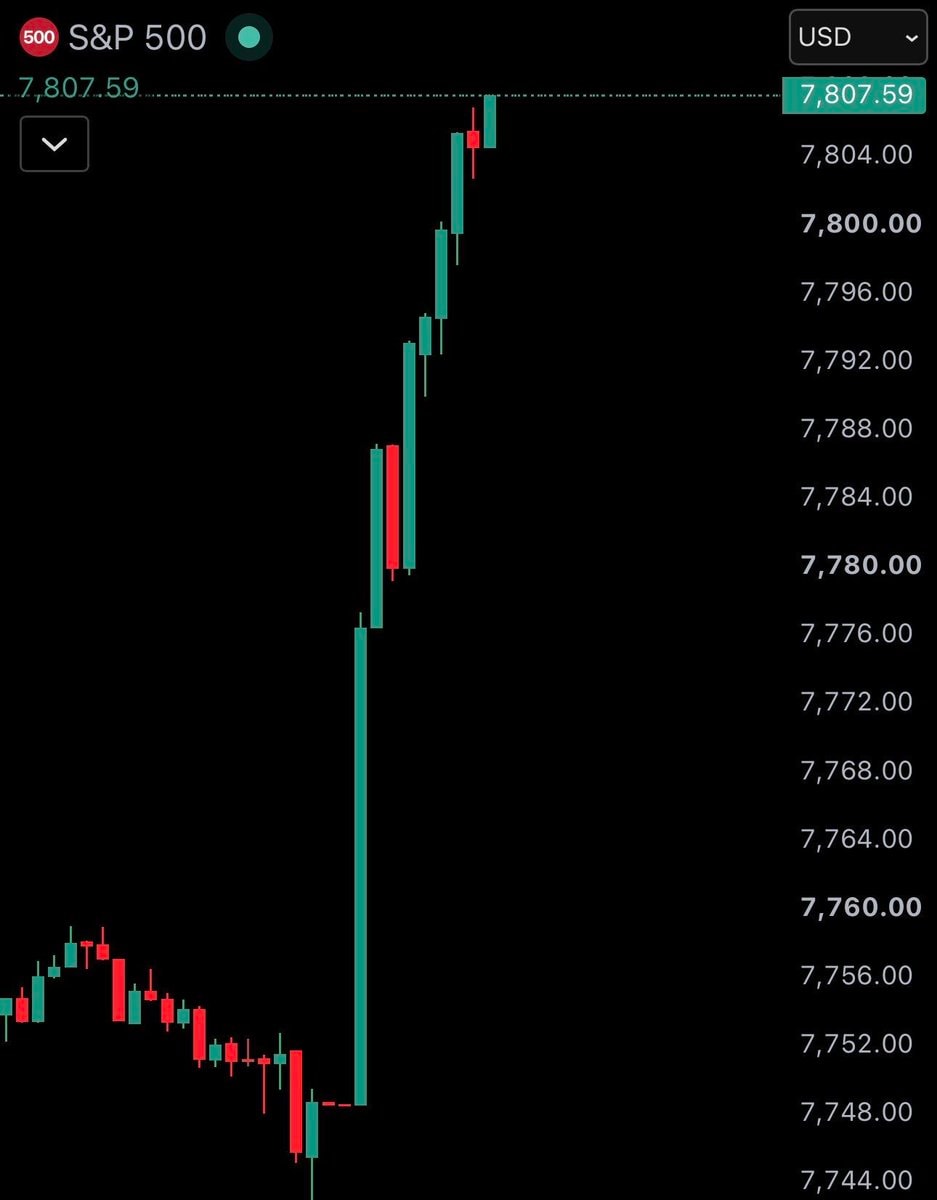 S&P 500 hits 7,800 record
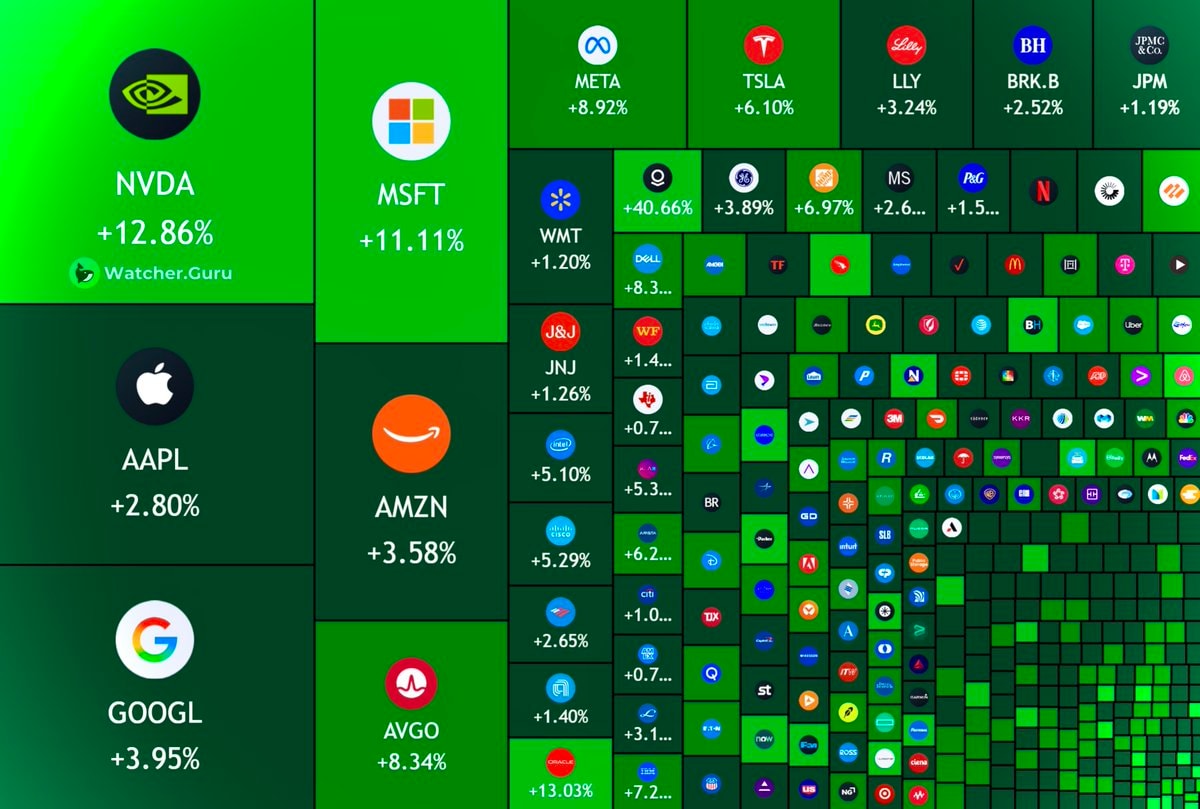 US stock market heatmap
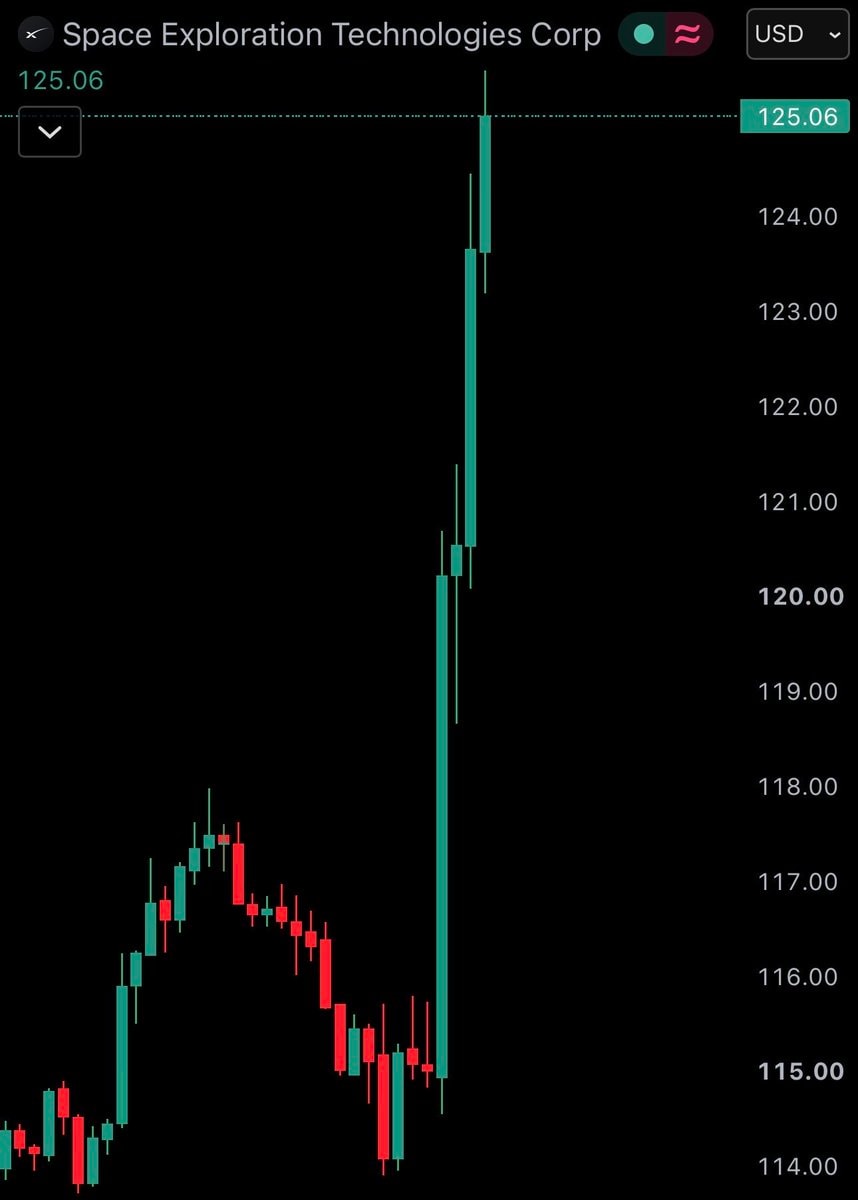 SpaceX stock chart surge
 2S&P 500 turns negative
 2Michael Burry market top 1987
 S&P 500 new all-time high
 S&P 500 all-time high 7,736
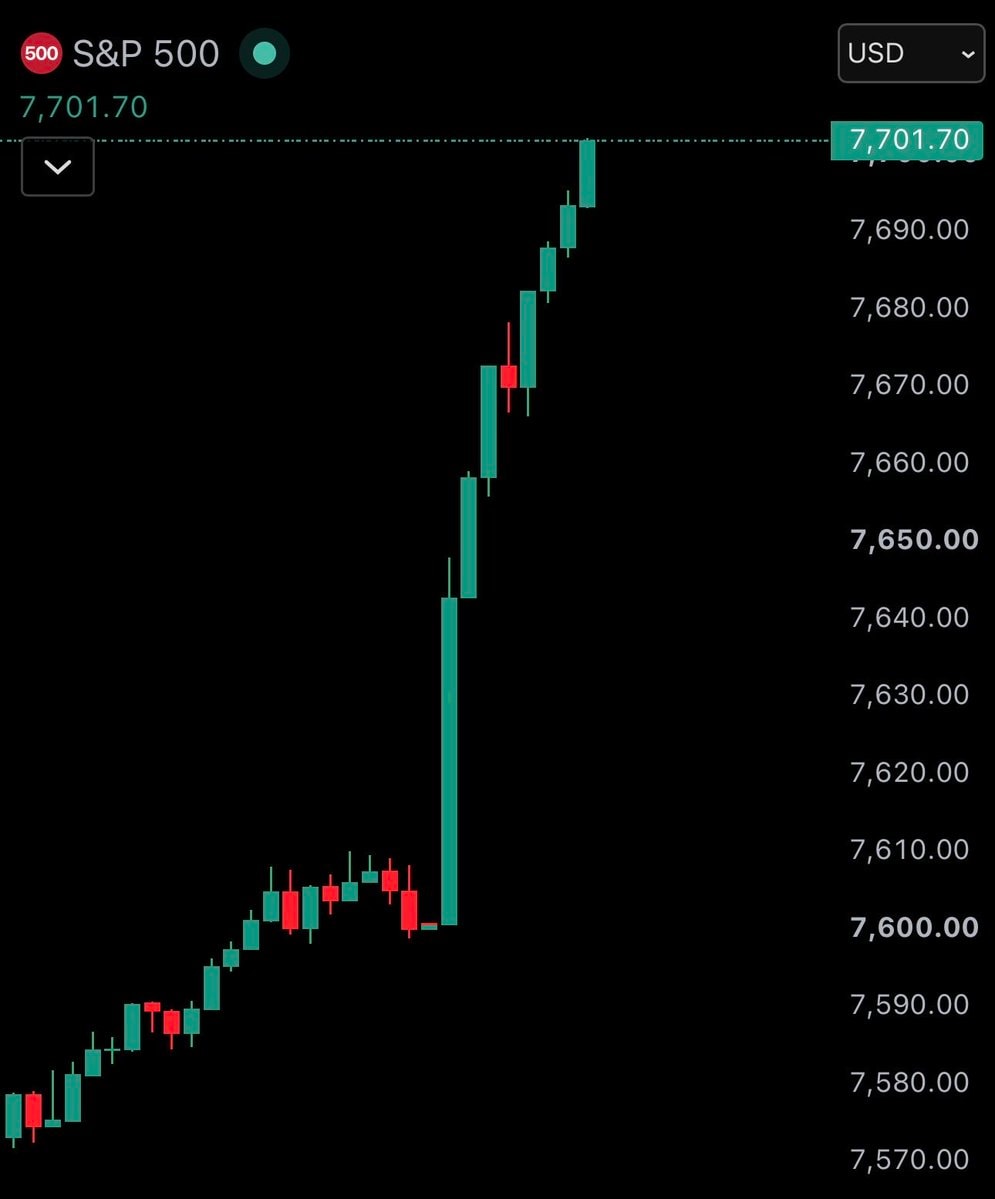 S&P 500 hits 7,700
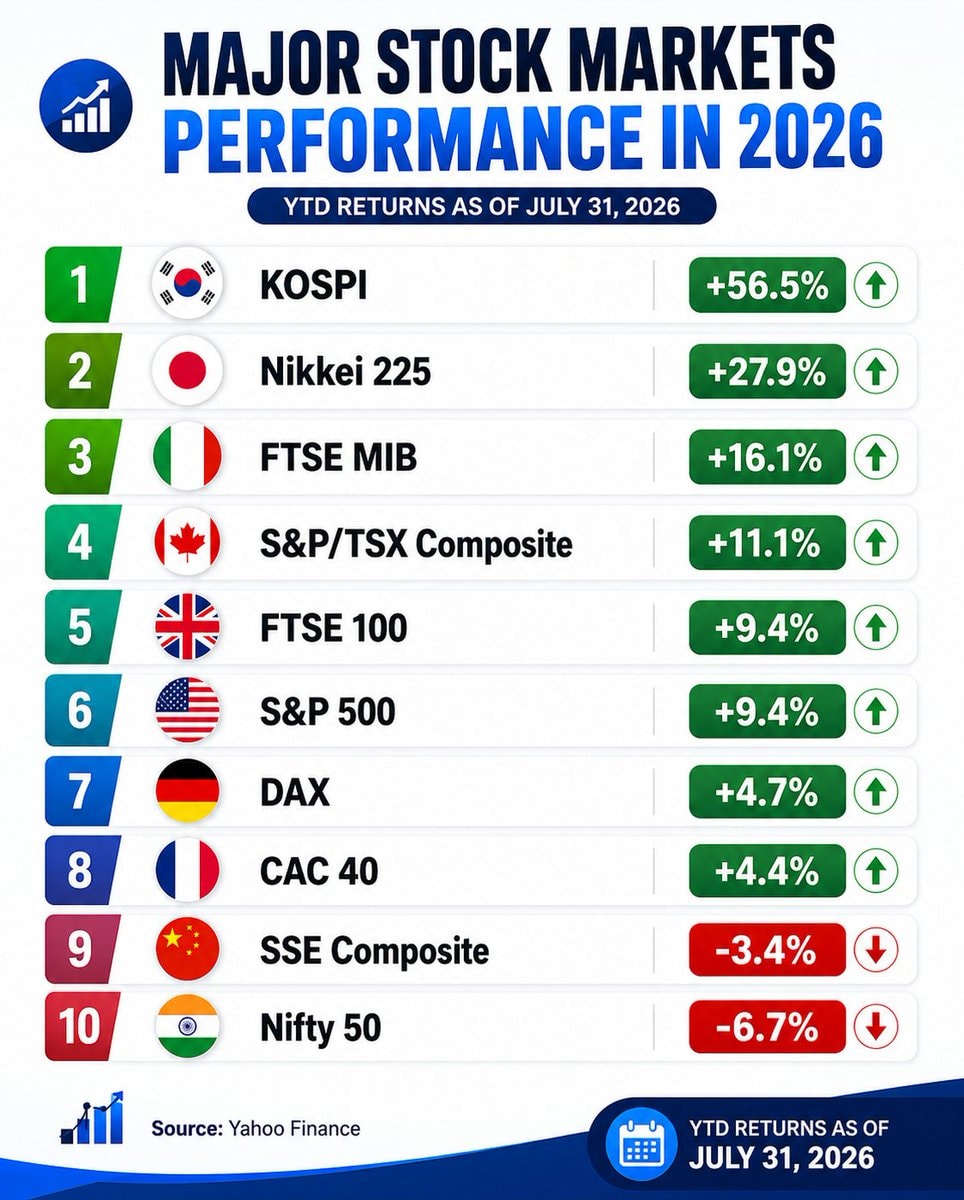 Major stock markets 2026 YTD returns
 2Amazon hits $3 trillion market cap
 2Amazon biggest single-day gain since 2012
 2Microsoft $MSFT biggest single-day gain since 2008
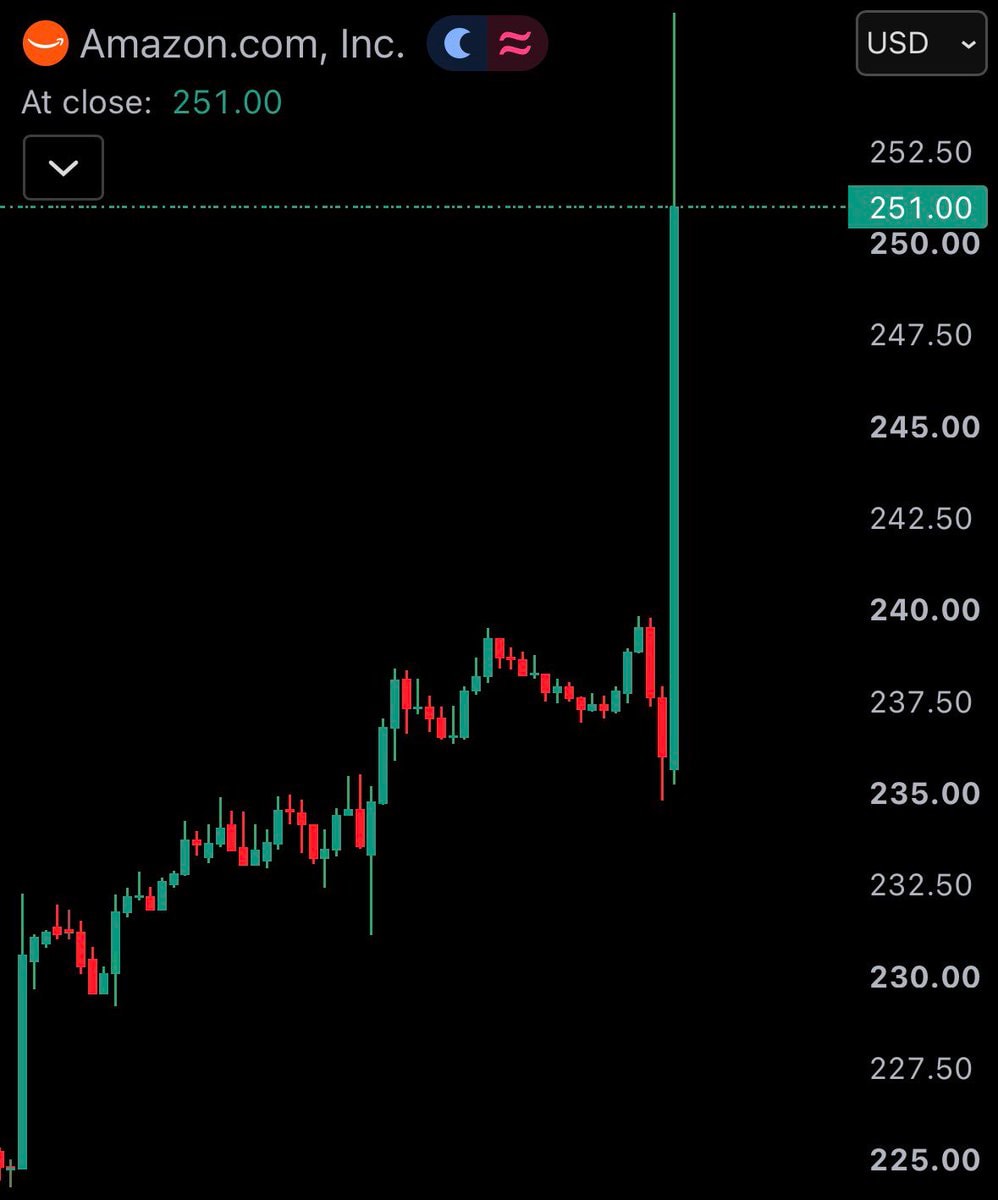 Amazon AMZN Q2 2026 revenue $200 billion
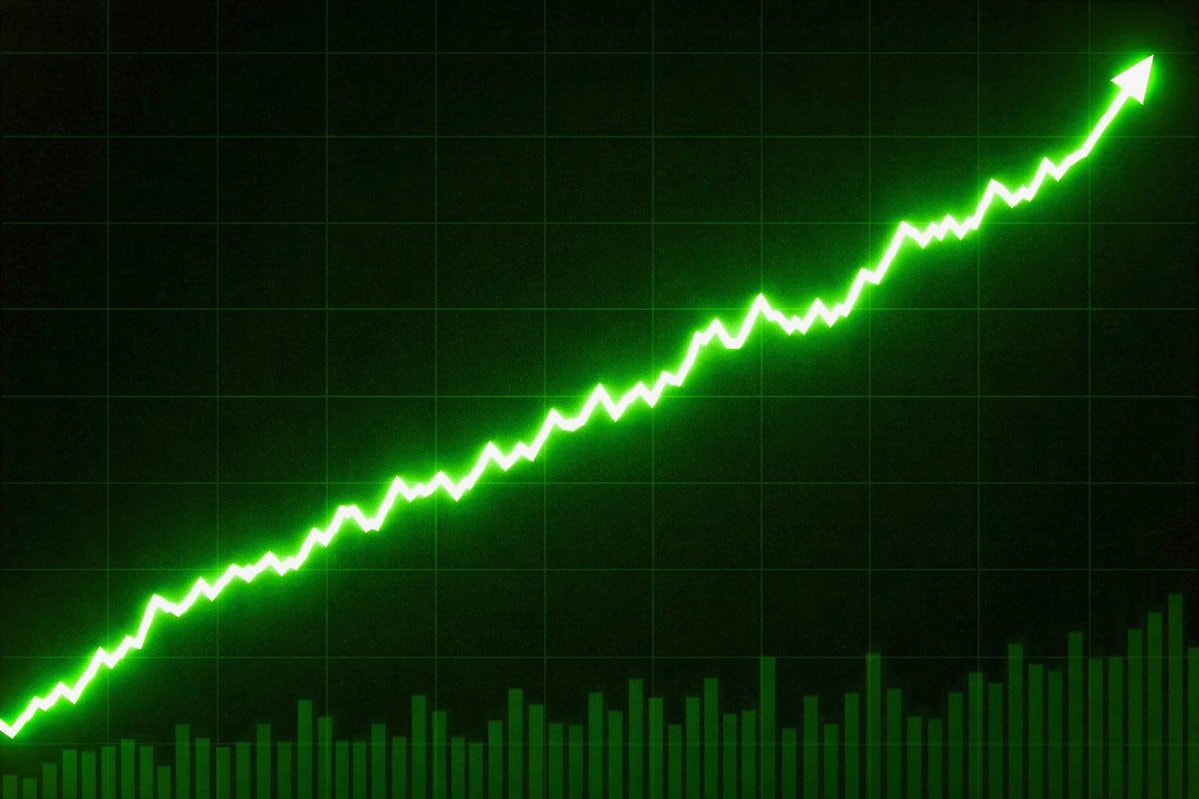
 US stock market green chart
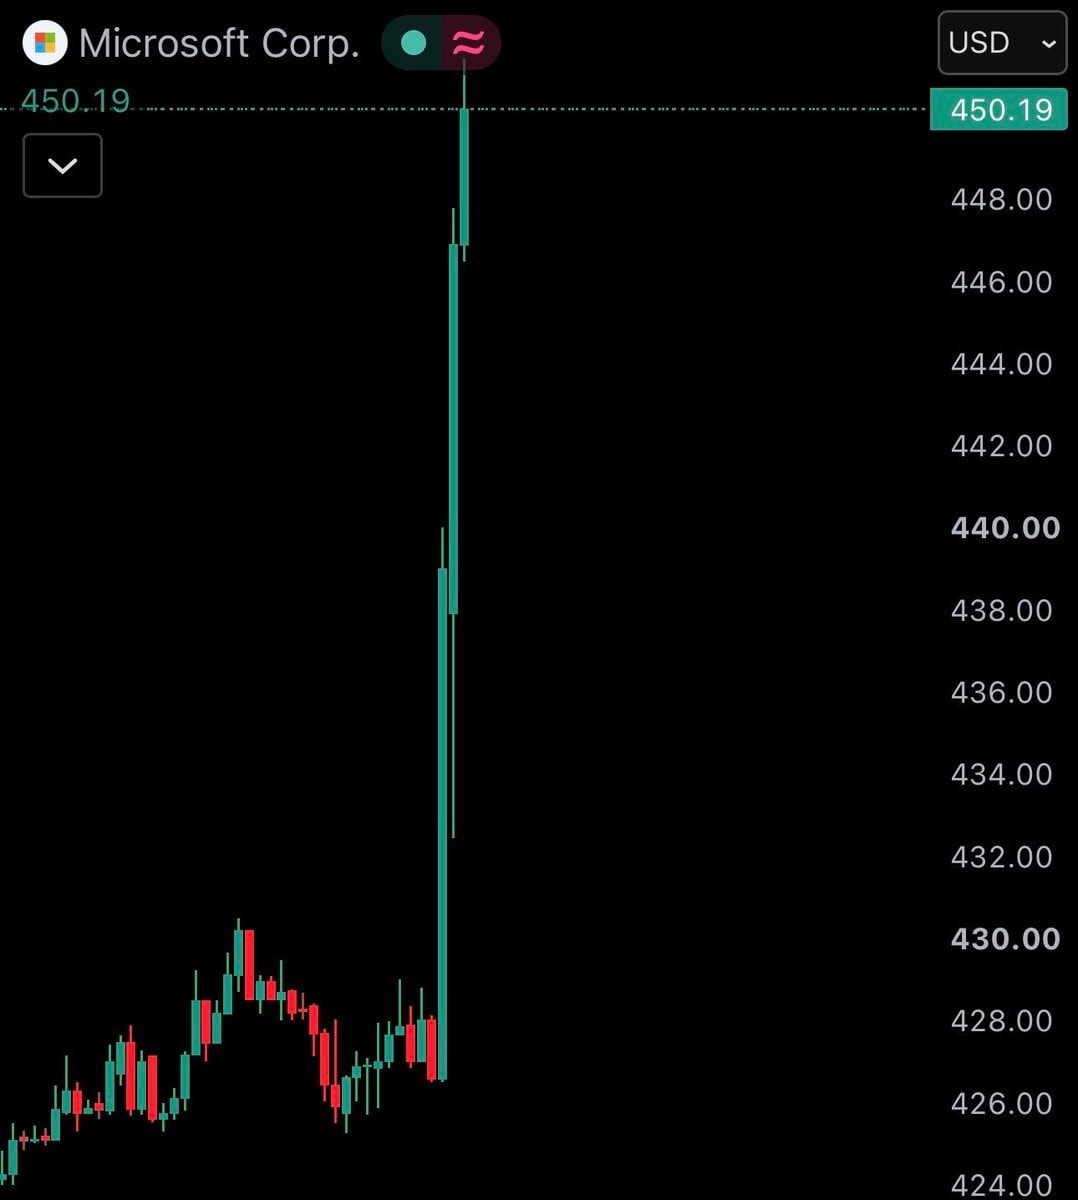 Microsoft $MSFT stock surge 15%
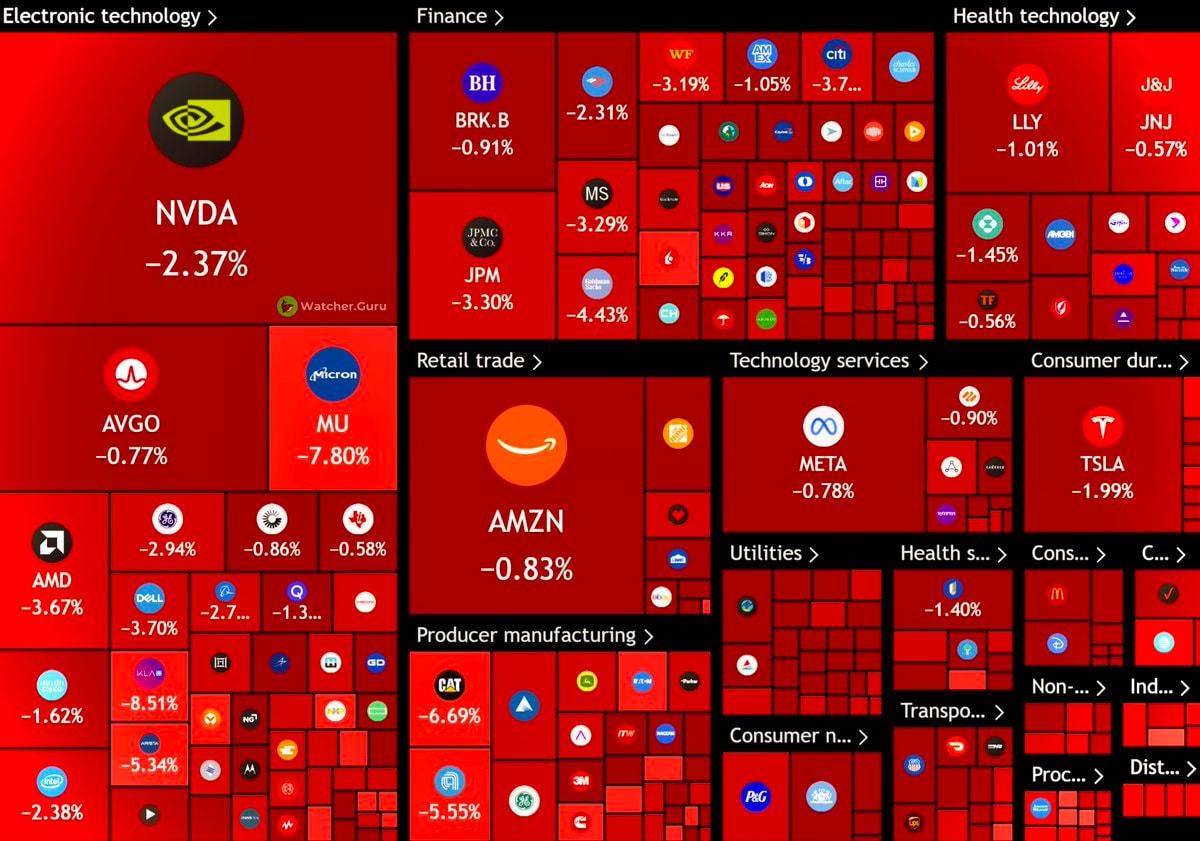 US stock market $1 trillion loss
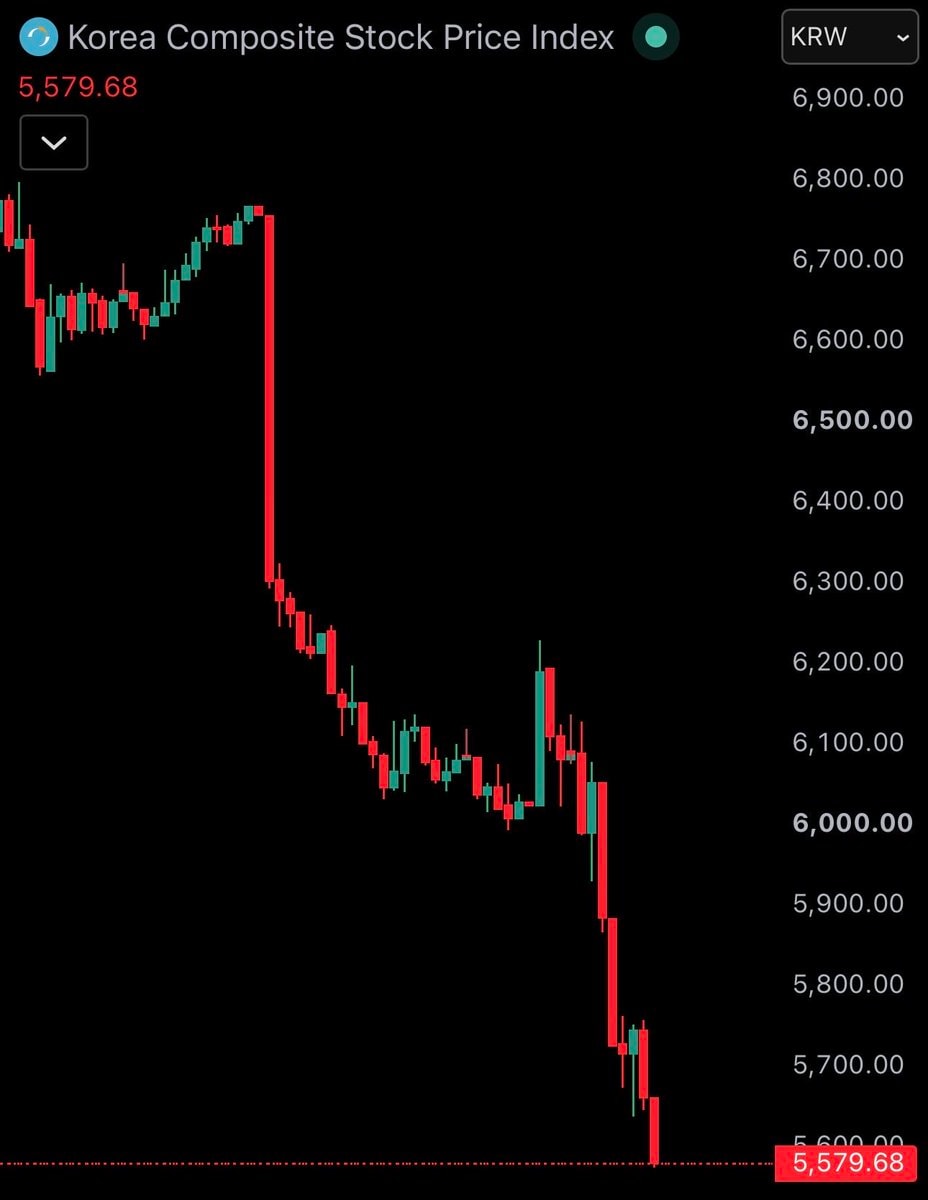 KOSPI crash 7% South Korea
@Jakob.erasUS stock market adds over $1.1 trillion in a single session
ดูโพสต์ต้นฉบับรูปภาพโดย @Jakob.eras· Jul 30, 2026· Stock Market
The image is a stock market heatmap displaying company logos and their percentage changes. The focus is on various publicly traded companies, with some prominent ones like NVDA, AMZN, and MSFT highlighted in larger tiles. The overall mood is informative and data-driven, presented in a clean, digital aesthetic. Notably, the green color scheme indicates positive stock performance, with large gains visible for MSFT (+16.55%) and MU (+18.10%). The on-screen text includes company tickers and their corresponding percentage changes, such as "NVDA +2.56%", "AMZN +4.81%", and "MSFT +16.55%".
S&P 500 record closeS&P 500 hits 7,800 recordUS stock market heatmapSpaceX stock chart surge2S&P 500 turns negative2Michael Burry market top 1987S&P 500 new all-time highS&P 500 all-time high 7,736S&P 500 hits 7,700Major stock markets 2026 YTD returns2Amazon hits $3 trillion market cap2Amazon biggest single-day gain since 20122Microsoft $MSFT biggest single-day gain since 2008Amazon AMZN Q2 2026 revenue $200 billionUS stock market green chartMicrosoft $MSFT stock surge 15%US stock market $1 trillion lossKOSPI crash 7% South Korea